
The U.S. Bureau of Economic Analysis has issued the following press release:
Today, the U.S. Bureau of Economic Analysis (BEA) released official statistics of real state personal consumption expenditures (PCE) for the first time. The new statistics cover the period from 2008 to 2020. Real PCE decreased 3.8 percent in 2020 for the nation after increasing 2.2 percent in 2019. Across states, the percent change ranged from 2.2 percent in Utah to –7.0 percent in Hawaii, Maryland, and New York; the percent change was –8.9 percent in the District of Columbia (table 1).
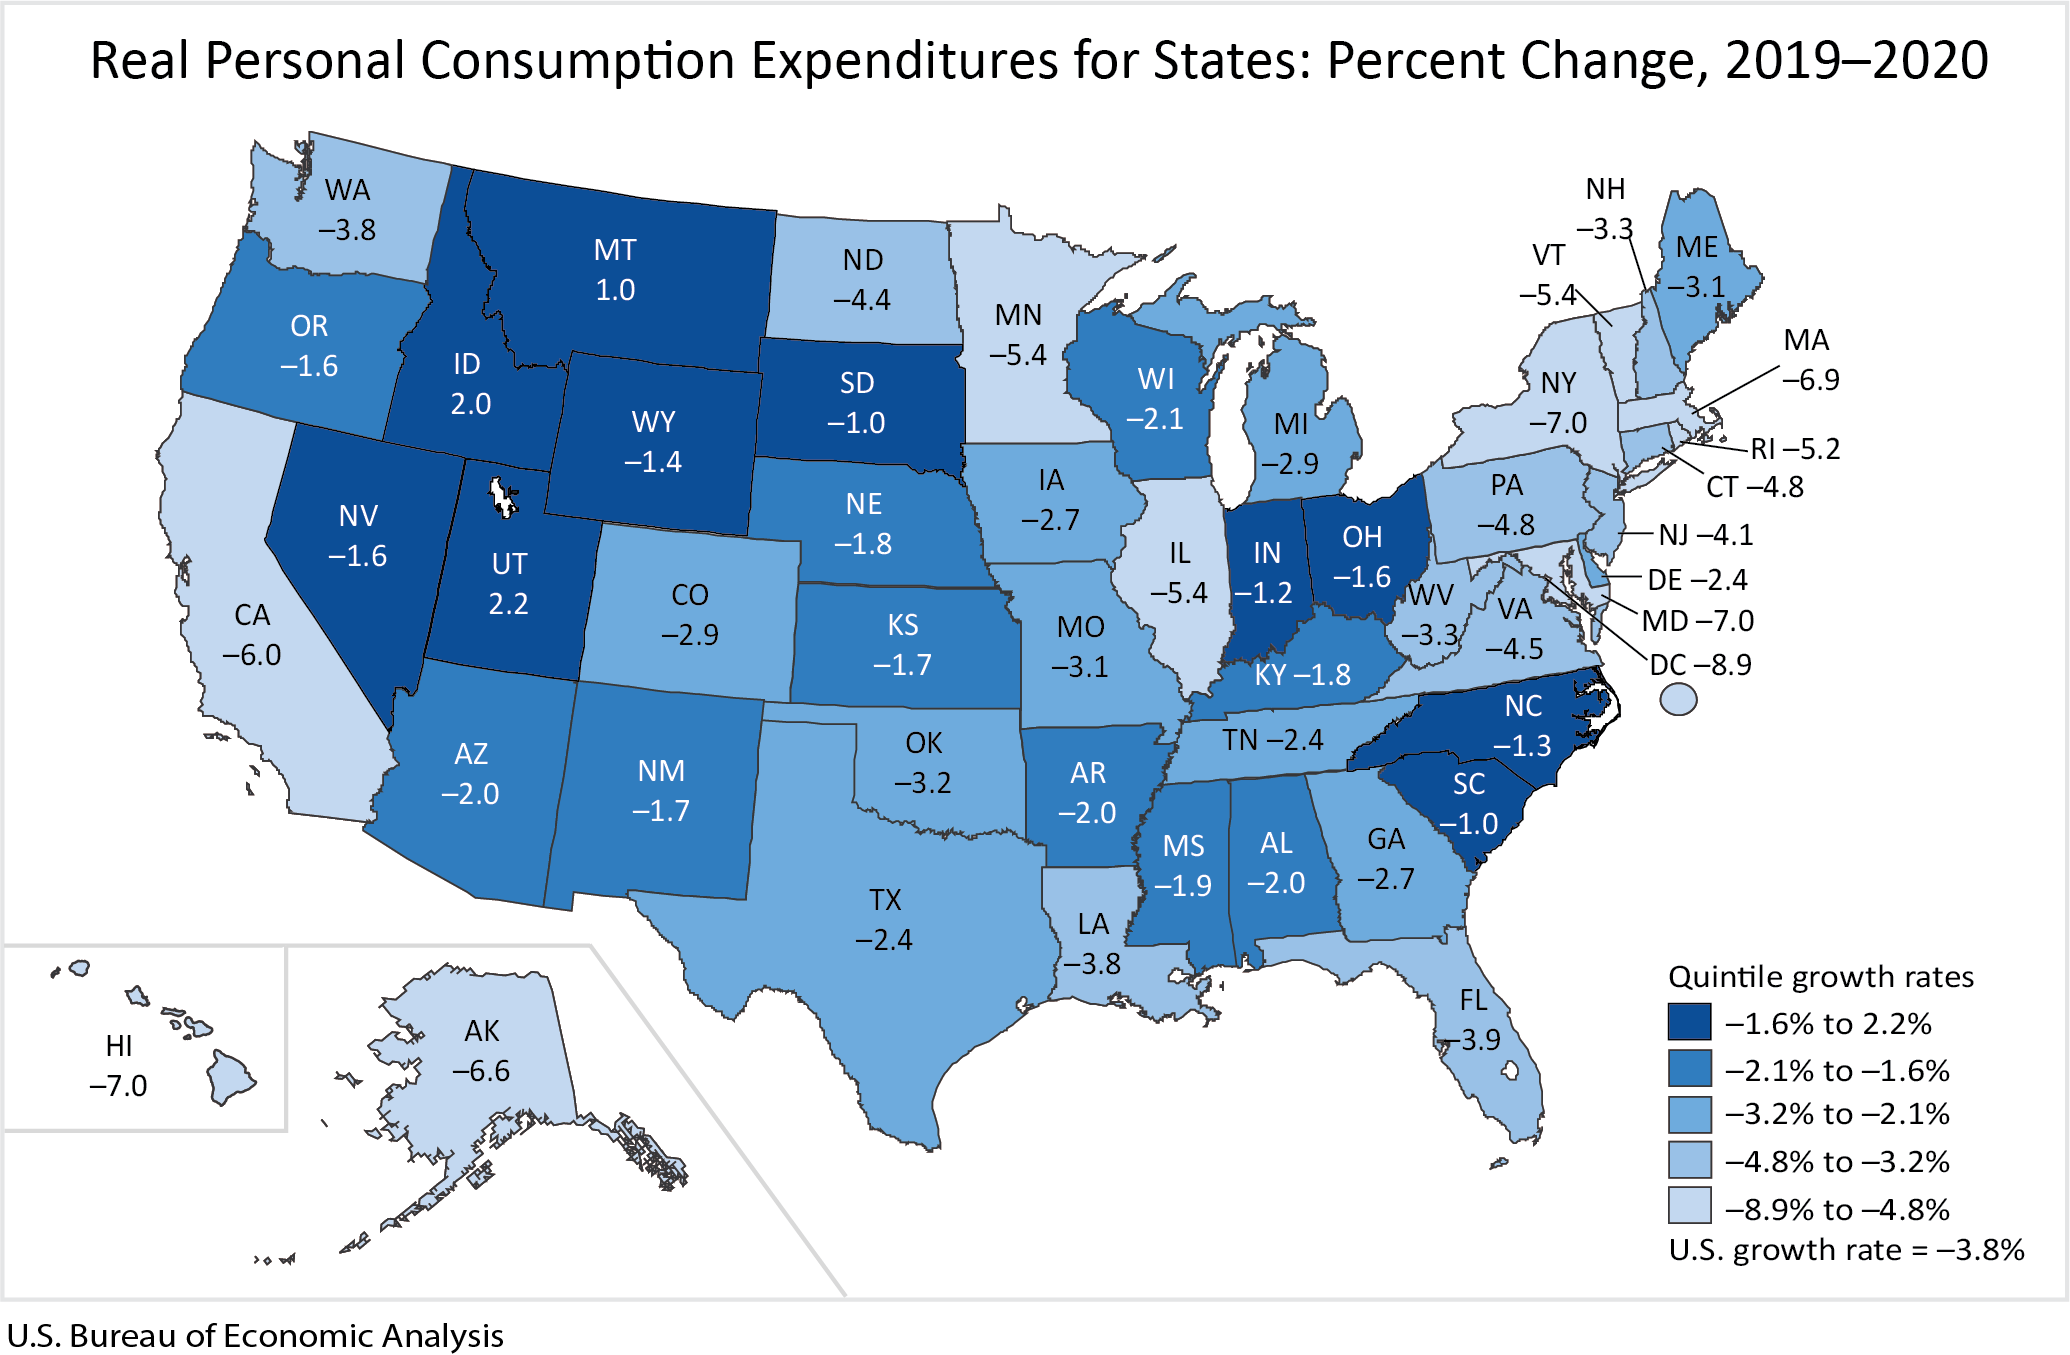
In 2020, real PCE decreased in 47 states and the District of Columbia and increased in only three states: Utah (2.2 percent), Idaho (2.0 percent), and Montana (1.0 percent). Real state PCE is a state's current-dollar PCE adjusted by the state's regional price parity and the national PCE price index.
- In Utah, Idaho, and Montana current-dollar PCE increased while their implicit regional price deflators decreased 1.0 percent, 0.7 percent, and 0.6 percent respectively (table2).
- New York, Maryland, and Hawaii had the largest decrease in real PCE. In all three states, current-dollar PCE decreased while their implicit regional price deflators increased 1.9 percent, 2.8 percent, and 1.8 percent respectively.
Real Personal Income
Real state personal income increased 5.3 percent in 2020 for the nation after increasing 2.6 percent in 2019. Across states, the percent change in real personal income ranged from 9.8 percent in Idaho to 1.6 percent in Alaska (table 1).
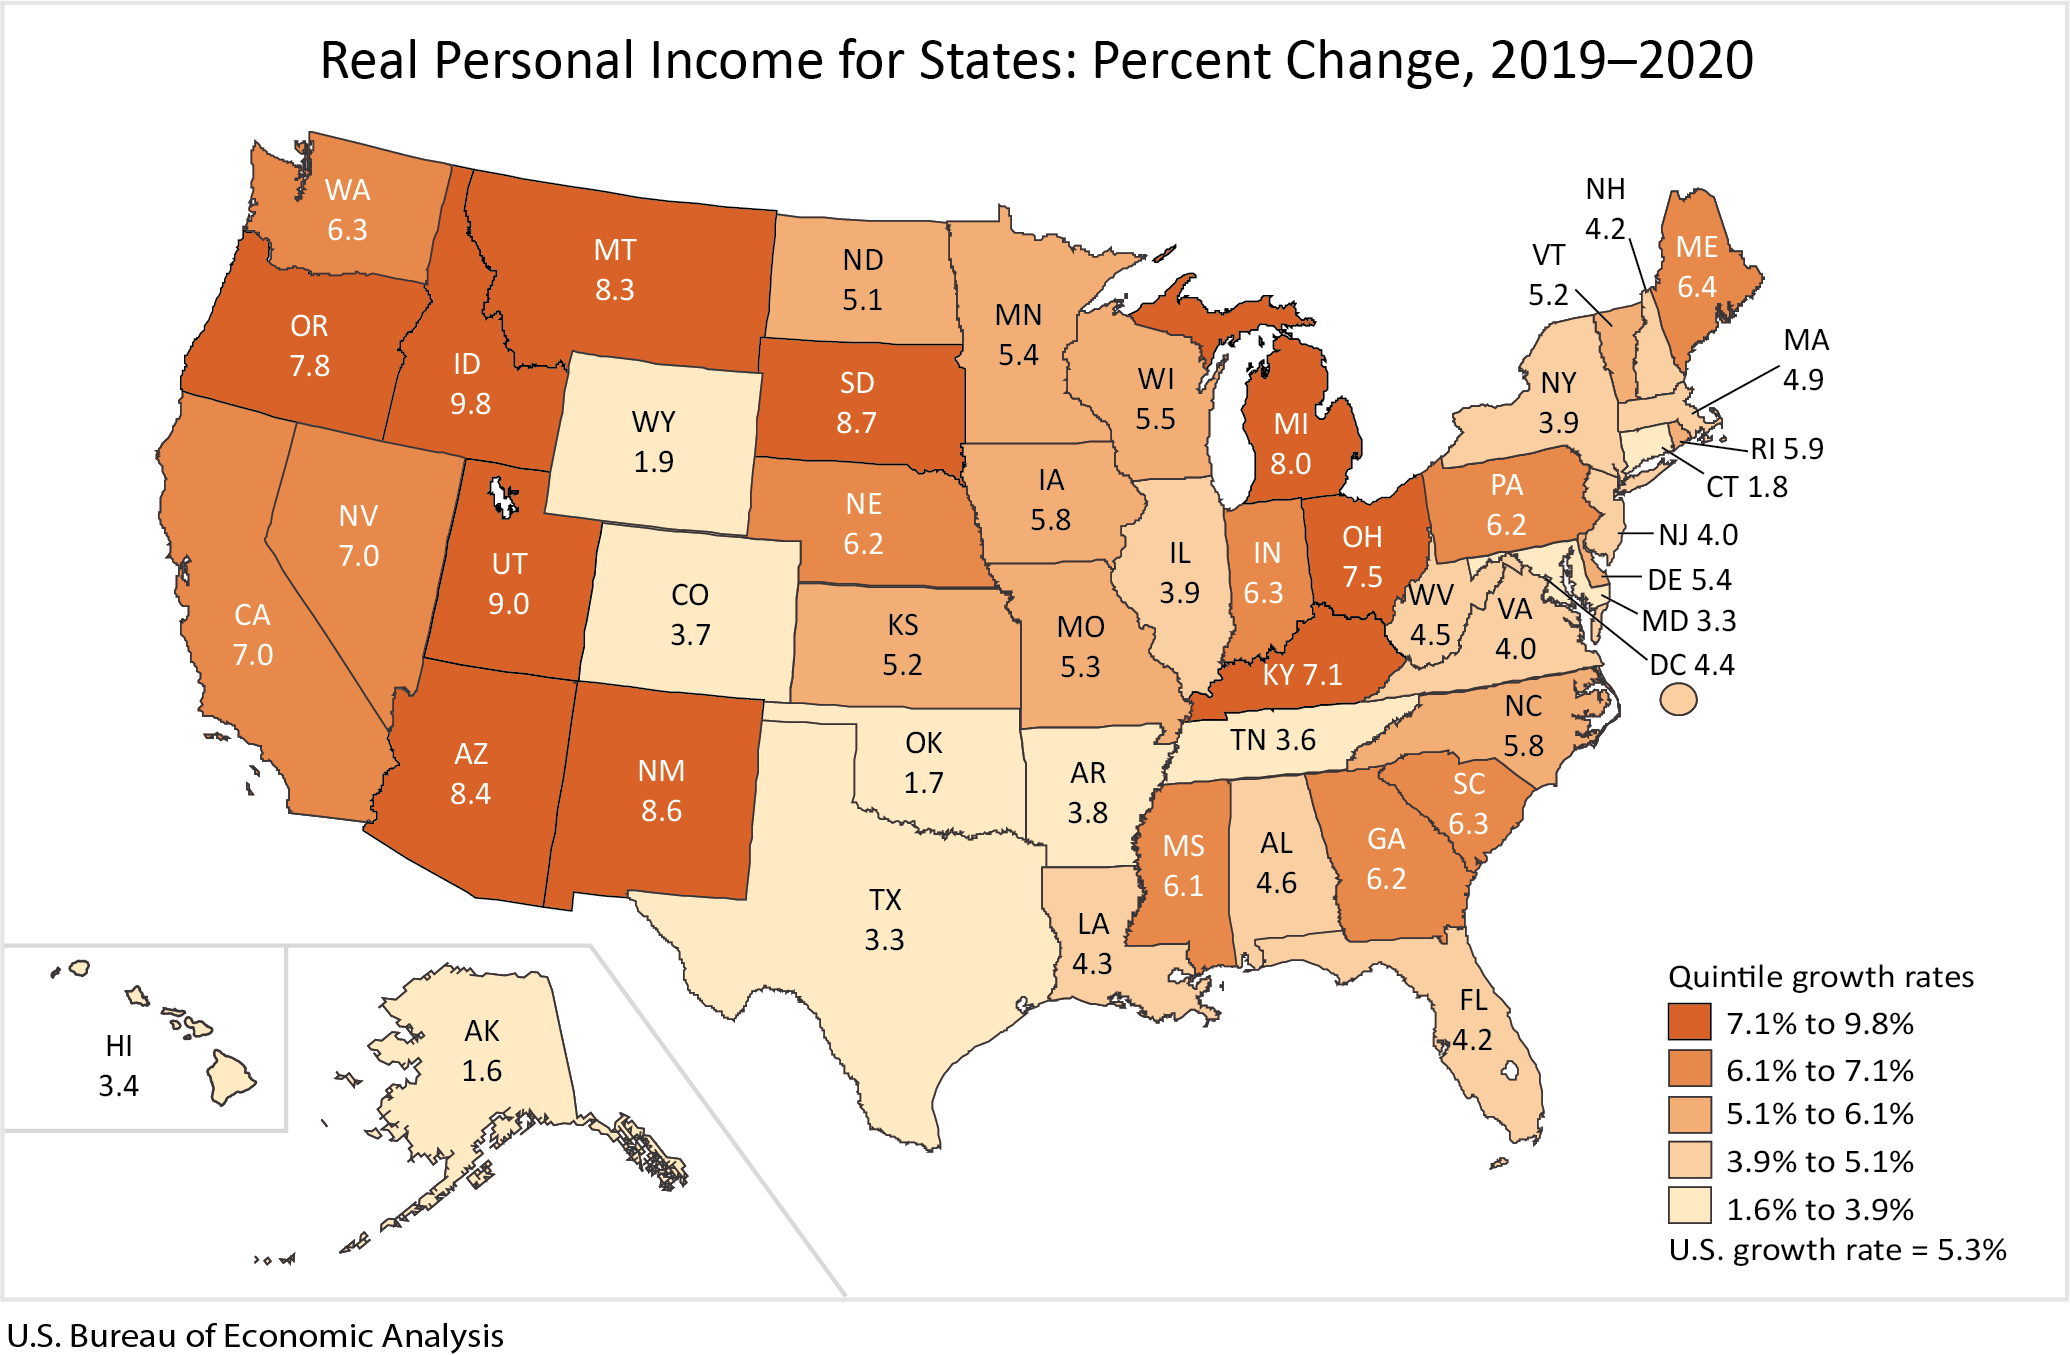
In 2020, real personal income increased in all 50 states and the District of Columbia.
- Idaho (9.8 percent) and Utah (9.0 percent) had the largest increases in real personal income. In both states, the implicit regional price deflator decreased.
- Alaska (1.6 percent) and Oklahoma had the smallest increases in real personal income. Their implicit regional price deflators increased 1.0 percent and 2.2 percent respectively.
Regional price parities (RPPs) measure the differences in price levels across states for a given year and are expressed as a percentage of the overall national price level.
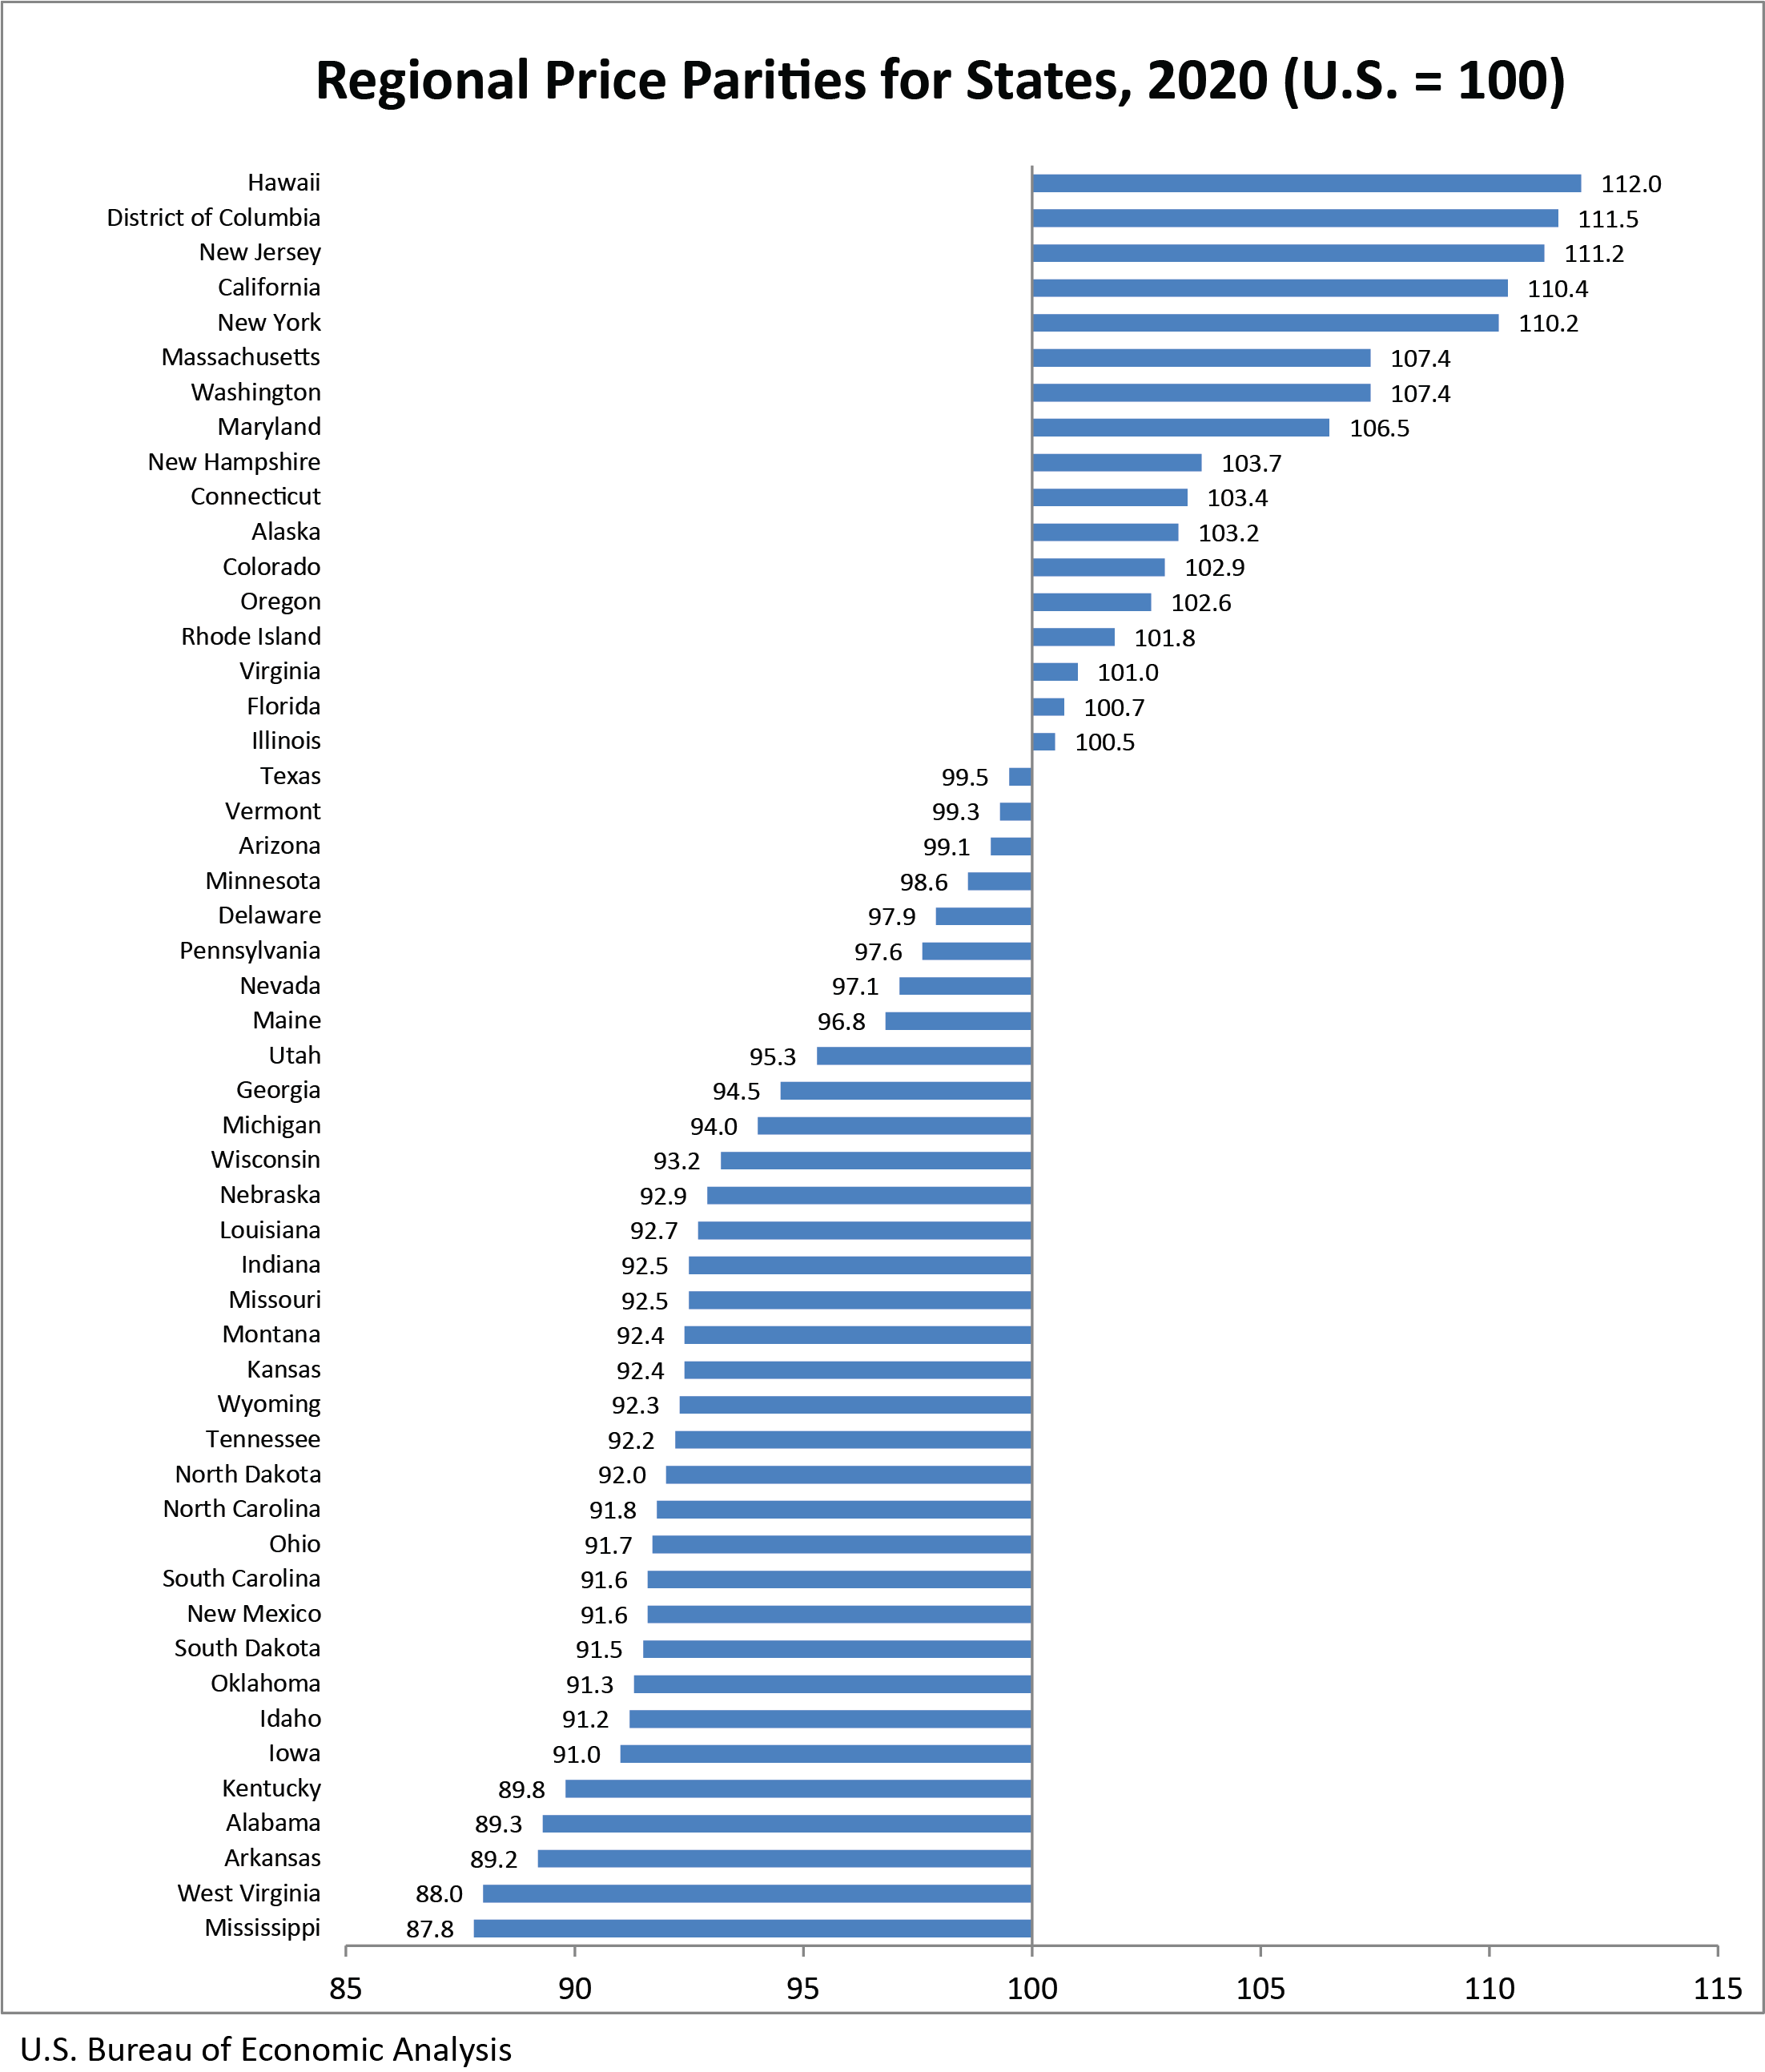
The all items RPP covers all consumption goods and services including housing rents. Areas with high/low RPPs typically correspond to areas with high/low price levels for rents.
- States with the highest RPPs were Hawaii (112.0), New Jersey (111.2), and California (110.4); the RPP in the District of Columbia was 111.5 (table 2).
- States with the lowest RPPs were Mississippi (87.8), West Virginia (88.0), and Arkansas (89.2).
- Across states, California had the highest RPP for housing rents (160.2) and Mississippi had the lowest (56.1); the RPP for housing rents in the District of Columbia was 168.9.